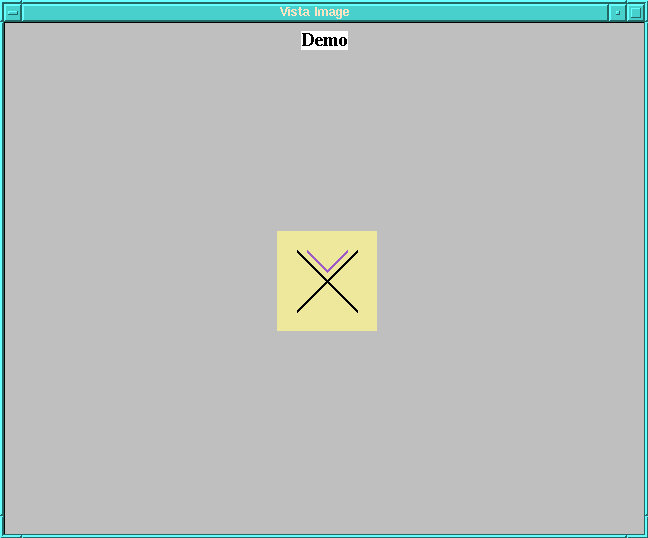
Figure 1: Vista image display window
The image display window simply shows the image and the image name as recorded in the FITS header. As you move the cursor around the image, the cursor pixel position and value are displayed in the upper left corner of the image control window. Vista puts the origin (0,0 pixel position) at the upper left hand corner. While the cursor is in the image display window you can do the following functions:
Middle Mouse Button: Brings up a help window listing the functions below.Left Mouse Button: Image in the 'Zoom window' of the Image Control Window will be updated.
Right Mouse Button: Similar to left mouse button, but the image is also redisplayed so that the pixel which was directly under the cursor is now positioned at the center of the display window. This is useful because the magnify buttons on the Control Window always magnify about the center of the display window.
Arrow Keys: Move cursor in the image window.
B or b: Allows you to draw a box on the image using the mouse. Follow the instructions which appear in a new window on the screen. The box limits the area in which a row or column plot will be plotted, if the cursor is within the box when R or C is pressed.
C or c: Produces a new window with a column plot of the image at the location of the cursor.
R or r: Produces a new window row plot of the image at the location of the cursor.
Z or z: Does a 'Zap' median filter at the location of the cursor. Serveral 'Zap' parameters can be modified via commands on the ITV popup menu from the Vista control window.
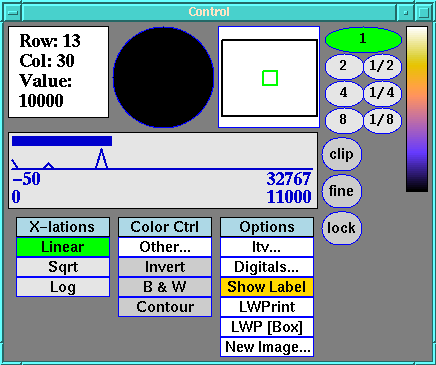
Image Control Window
Figure 2: Vista image control window
The image control window allows you to manipulate the displayed image
in a number of ways, including color map and zooming. Clicking the
middle mouse button in the different regions of this window brings up
an appropriate help window.
Image cursor position (row and column) and value are displayed in the
upper left hand corner of the control window.
A small zoomed image is displayed in the top left center round
region. This is updated by pressing the left (or right) mouse button
in the image display window.
The top right center square region denotes the image display window
area (black outlined region) with the image area (green
outlined region). You can move the image around the display region by
clicking (with the left or right mouse button) on the part of the
green outlined image you want centered on the display.
The oval buttons on the right of the control window control the zoom
factor of the image display window (from 1/8 to 8 times zooming). The
other oval buttons (clip, fine, and lock) allow you to control the
color map:
The color bar at the farthest right shows the current color map. In
the color bar, moving the mouse up or down while holding down the left
or right button, will allow you to "roll" the color map up or down.
At the center of the control window is a histogram of the pixel values
in the image. Above the histogram is a solid bar showing the range of
values the color bar (at the right of the window) covers. Below the
histogram is the range of values the histogram covers (top numbers)
and the range of values the color bar covers (bottom numbers). The
range of values for the color bar can be manipulated with the
mouse. To do so, put the cursor on the solid bar above the
histogram. The cursor should change into either an arrow pointing up,
or an arrow pointing to the upper left or right. By holding down the
left or right mouse button, you can move the entire color bar
(straight up arrow) or change its length (upper left or right pointing
arrow). When you release the mouse button, the image will be
redisplayed with the new color map.
The X-lations menu allows you to chose either Linear, Square Root
(Sqrt), or a Logarithmic (Log) color scale.
The Color Ctrl menu allows you to choose other color tables
(Other...), Invert the current color map, switch to a Black and White
(B & W) color table, or switch to a Contour map.
The Options menu has a number of additional choices for examining the
displayed image. The menu options (Itv..., Digitals..., and New
Image...) will be discussed in more detail later. The other options
are:
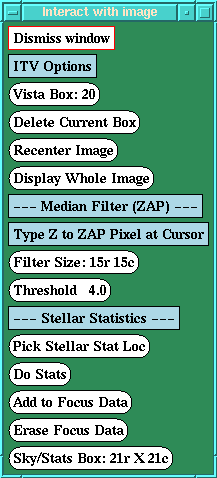
Itv Menu
Figure 3: Interactive TV Menu
Vista Box: 1 (or any number 1 to 20). This can save box parameters for
the display window. Pick a box number and then use B to set the box
in the image display window.
Delete Current Box. Does just what it says.
Recenter Image. This will redisplay the image with the center of the
image at the center of the display window.
Display Whole Image. This will zoom (or unzoom) the image so the
entire image is displayed in the display window.
Filter Size: 15r 15c. This both tells you the current size of the
median filter box as well as lets you change it to whatever values you
wish.
Threshold 4.0. Both tells you the current threshold used in median
filtering as well as allowing you to change it.
Pick Stellar Stat Loc. Allows you to pick a position on the image for
doing stellar statistics. To do this simply click (with left mouse
button) on Pick Stellar Stat Loc then click on the desired point on
the image.
Do Stats. Brings up the Statistics Window for the
position marked by Pick Stellar Stat Loc.
Add to Focus Data. Allows you to input a focus number (whatever is
applicable for the telescope/instrument you are using) and it will be
saved with the stellar statistics you just measured. This can be
repeated for stars for different images and focus values. All inputed
focus points points and data are fitted by a parabola to give the best
focus position.
Erase Focus Data. Erase all focus data currently in buffer.
Sky/Stats Box: 21r X 21c. Both shows current sky/stats box size and
allows you to change size of box over which sky statistics are
calculated.
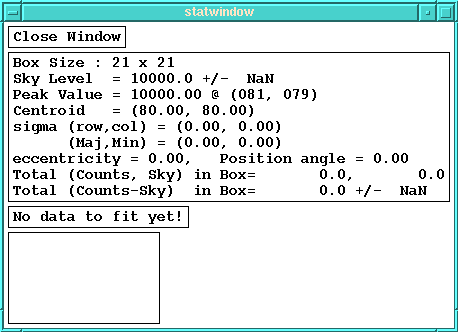
Statistics Window
Figure 4: Statistics Display
This window displays statistics for the star or region designated by
the Pick Stellar Stat Loc option on the Itv menu. The following data
is calculated for the region within the box (as set by Itv Sky/Stats
Box): sky level, peak value, centroid, sigma, eccentricity, position
angle, total counts, and total counts minus sky.
The bottom box shows a plot of the focus data and the best fit
parabola (when there are 3 or more data points) with an estimate of
the best focus position. Focus data is added using Itv Add to Focus
Data option. A status bar above that box gives the fitting status
(e.g. No data to fit yet! or Need 1 more point.)
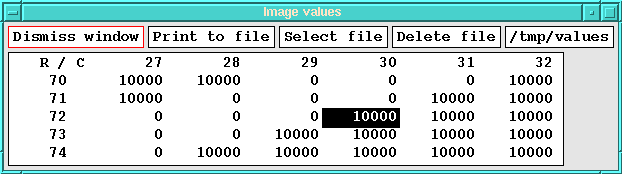
Digitals Window
Figure 5: Digitals Display
After clicking on Digitals... with the left mouse button, the computer
waits for you to click on the point of interest in the image display
window. The window shown in Figure 5 will then be displayed showing
the pixel values for that point and a few rows and columns around it.
The data may be saved to a file for later recall using the Print to
file button. You may also elect to read previously saved data from a
file using the Select file option.
Clicking on another point in the image will update the digitals
display for that new point. You may also click on a pixel value in the
digitals window to center around that point.
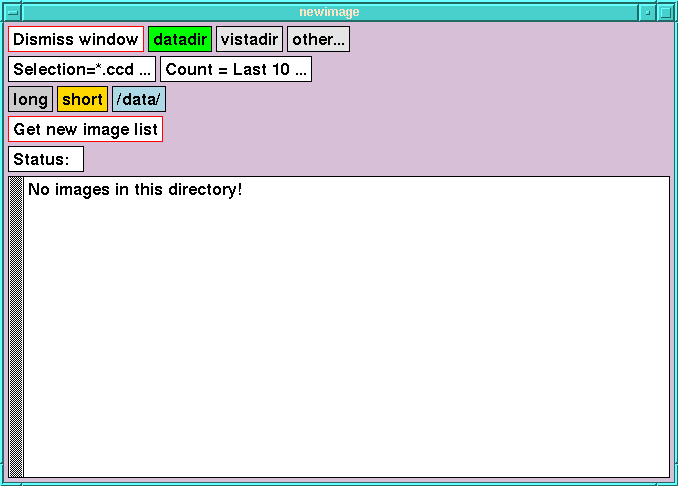
New Image Menu
Figure 6: New Image Display Menu
This menu allows you to display FITS images stored on disk. The
default directory is the data directory for the instrument you are
using (the /data directory). If New Image is not seeing that
directory, you can get there by clicking on datadir. The other easily
accessed directory is the Vista directory (by clicking on vistadir).
If you want to access a different directory, use the other... button
and input the full path to the directory you want.
Selection=*.ccd. Shows what files are being selected and allows you to
change the default extension, e.g. *.fits will show any filenames
ending with .fits, *.* will show every file in the chosen directory.
Count = Last 10 .... Allows you to chose how many files are displayed
as options for loading. The default is the last 10 files written to
disk. Entering 0 shows all files, -N shows last N files written, N
shows first N files written.
long. Shows long description of image (i.e. file name, image size,
date written, object name).
short. Shows just the file names to choose from.
The box right of the "short" button shows the path name for the files
listed (in Figure 6 above the path is /data/).
Get new image list. Once all the above parameters are set, then click
here to update the image list.
Status: Gives a status message (e.g. 10 image names, Displaying, etc.).
The bottom large window lists the files available for
displaying. Figure 6 above shows that there are currently no *.ccd
images in the /data/ directory for displaying. If there are images to
display, just click on the image name to display it.
Clip: Prevents wrapping of the color map.
Fine: Allows fine adjustment of the color range using the mapping bar
to the immediate left.
Lock: Locks the current color map and prevents autoscaling when
displaying a new image.
Show Label: Toggle switch to display file name and FITS header object
name on image display.
LWPrint: Print full image in grayscale using color parameters set with
the control window. This usually makes a very large file and is not
the recommended way of printing images.
LWP [Box]: Print only the image within the box (defined by using B or
b in the image display window). This produces smaller files and is
the recommended way of printing your image from Vista.
Last modified: Tue Apr 6 15:07:19 PDT 1999
by Elinor Gates