UNIVERSITY
OF
CALIFORNIA
OBSERVATORIES
LICK
OBSERVATORY
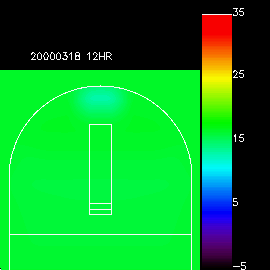
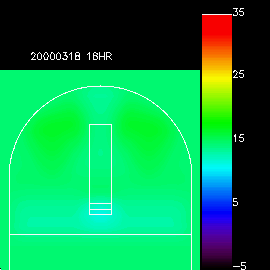
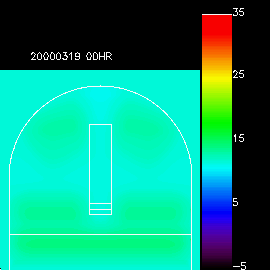
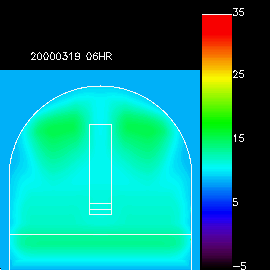
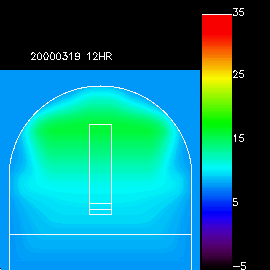
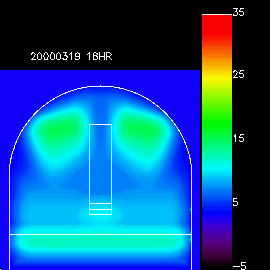
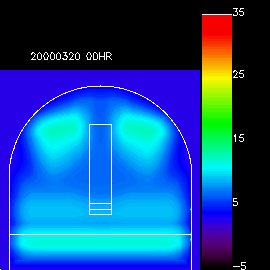
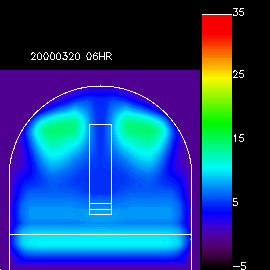
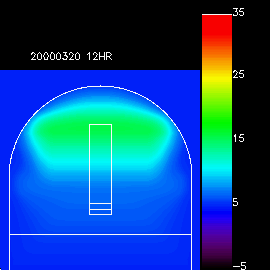
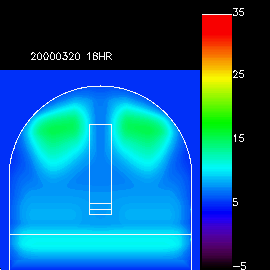
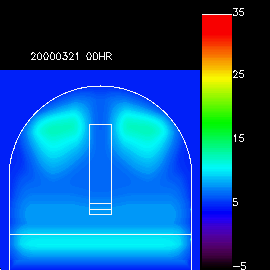
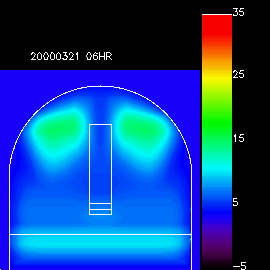
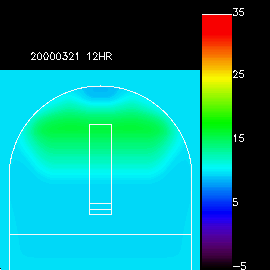
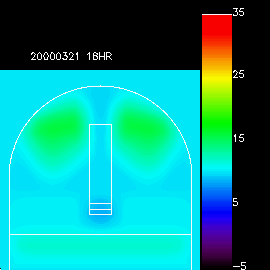
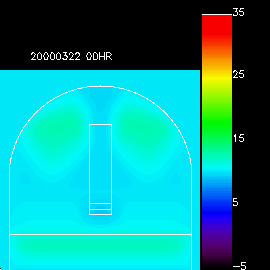
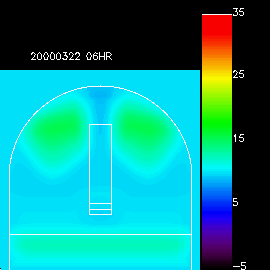
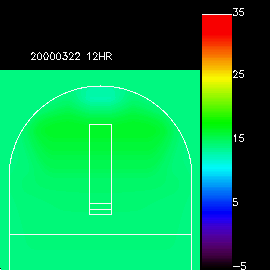
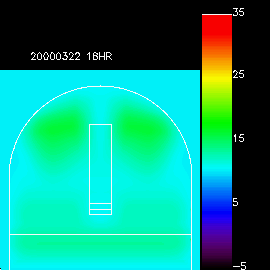
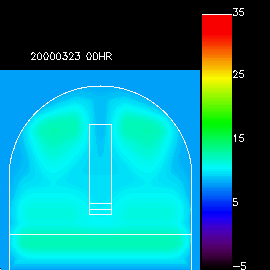
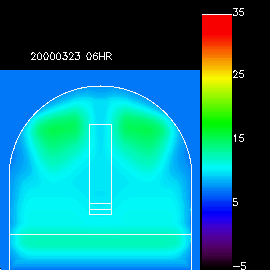
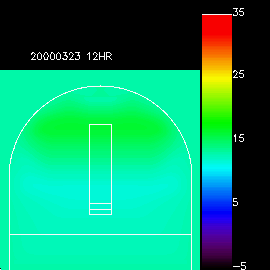
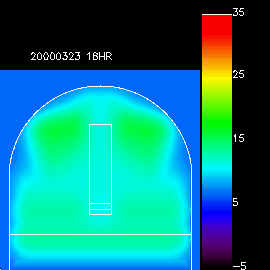
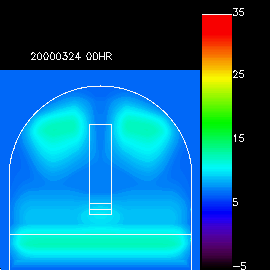
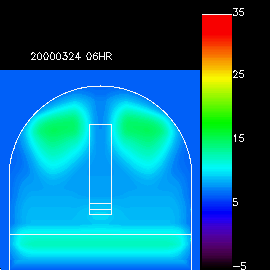
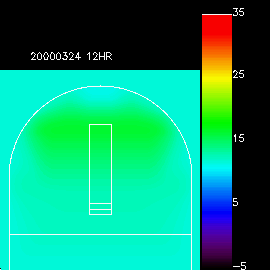
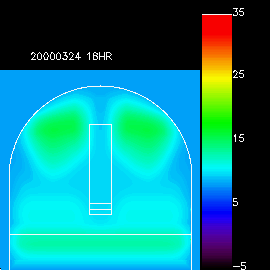
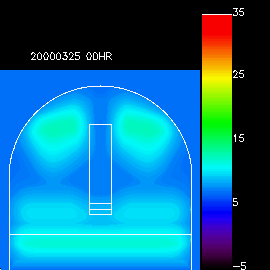
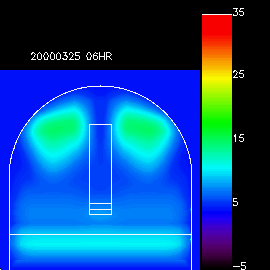
2000 March 18 to 2000 March 24 Temperature Maps
Temperature maps of the 3m dome for the data are shown for every six hours.
Data is organized by date from noon to 6 A.M. of the following day.
All temperatures are in degrees Celsius.
Noon
6 P.M.
Midnight
6 A.M
Last modified: Tue Dec 28 12:53:33 PST 1999
by Elinor Gates