Data Quicklook
Kast has a quicklook data reduction facility to extract 1-d spectra from the raw 2-d spectra. Required files are an arc lamp, flat field, and the data frame. Processing takes many minutes to extract the 1-d spectrum. Also, it may not yet be implemented for all gratings, grisms, tilts, or blue x-stage positions, but the most commonly used settings should work. The quicklook software is part of the Python PyPeIt package. The full pypeit package is installed on our data reduction computer, so if you want to use it to fully reduce your data, contact a support astronomer. duck is not that fast a computer, so it would probably be better to reduce the data on your own computer after installing pypeit.Currently the quicklook data reduction works for all grisms on the blue side, and most gratings for the red side, but the 300/4230, 600/3000, and 830/8460 in 2nd order gratings have not yet been tested.
Quicklook GUI | Examining the 1-d Spectra | Examining the 2-d SpectraQuicklook GUI
The quicklook GUI runs on our data reduction computer duck. To log in and start the software type the following:- ssh -Y user@duck
- quicklook kast
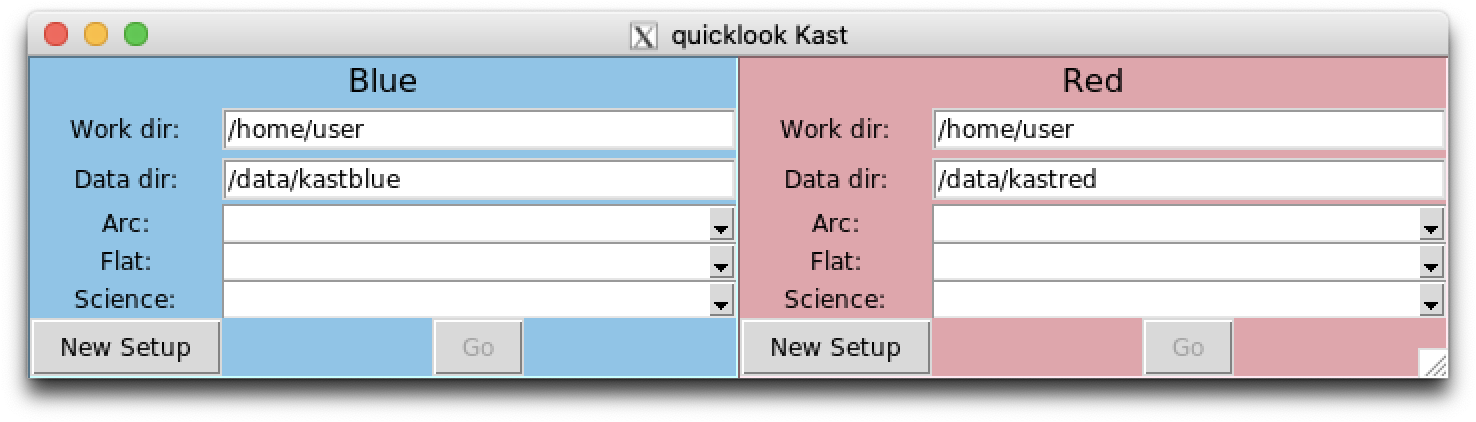
In most cases the work directory (Work dir:) and data directory (Data dir:) should not be changed. However, if you have data in another directory on duck, i.e. /home/user/observers/yourname/) you may want to change the Work dir and/or Data dir accordingly. Note, that data reduced on duck will be cleared out periodically to maintain appropriate levels of available disk space, so you'll want to copy the data to your home computer before leaving the telescope.
The default data directories are the locations of the raw data when observing at the Shane, /data/kastblue/ and /data/kastred/. To select the Arc, Flat, and Science data files, you can either type in the file names, or click on the down arrow at the right side of each entry field and it will give you a list of available files in the data directory. Be sure to enter arc and flat field files that match the setup of the science data, or the program will fail to properly extract a spectrum.
The New Setup button clears a previous user's or different setup calibration files, for the blue or red side. It is wise to push this button before running this program if you aren't sure if someone else has used the program. You also want to click this button if you are going to do a quick reduction of data using a different grating, grism, or wavelength range setting than the previous quick reduction.
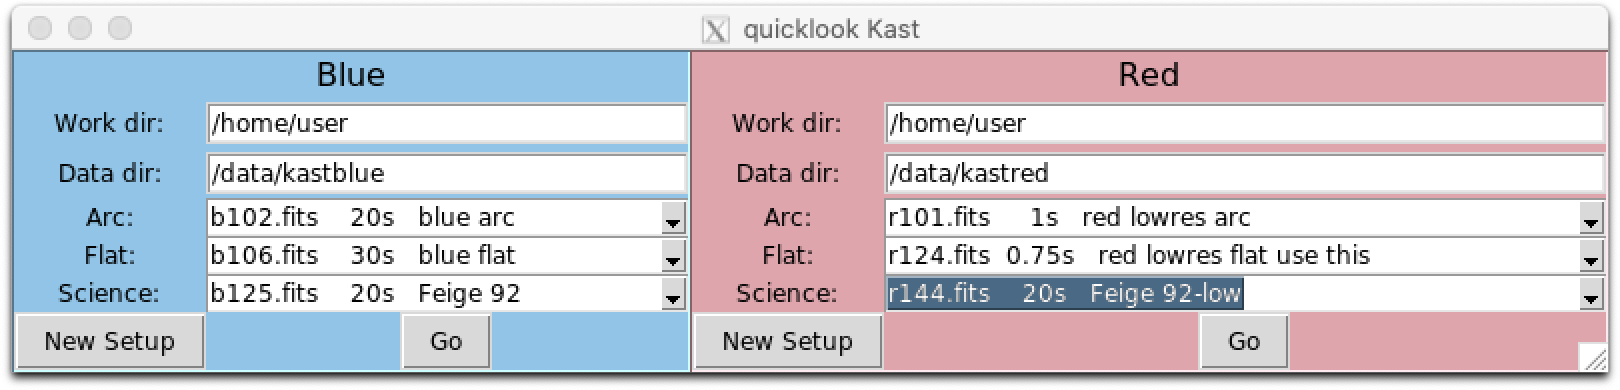
Once you have set the desired calibration and science files, push the Go button. While the data are being analyzed, the button will be grayed out and display Cancel, which allows you to abort the quick reduction in progress if you discover an error. When the button returns to Go the procedure is done.
The extracted 1-d data and corresponding calibration files are located on duck in the shane_kast_blue_A and shane_kast_red_A subdirectories in the specified work directory, for blue and red data respectively. In each of these directories, there are a number of subdirectories: Masters, QA, and Science, as well as a couple text files with information about the raw data files that were processed. For the most part the only directory that concerns quicklook reduction is the Science subdirectory because that is where the 1-d spectrum is located. The 1-d spectrum is a FITs file with a name spec1d_Dichroic-ObjectName_KAST[rb]_DateReduced.fits, e.g. spec1d_r57-feige110_KASTr_2020Jan05T020126.880.fits. Additionally a diagnostic 2-d spectrum is created, but for quick-look purposes you probably won't need to examine it.
Examining the 1-d Spectra
Examining the 1-d spectra can be done with any program that can read FITS tables, but the easiest way on duck is to use the pypeit_1dspec GUI.- ssh -Y user@duck
- pypeit_1dspec
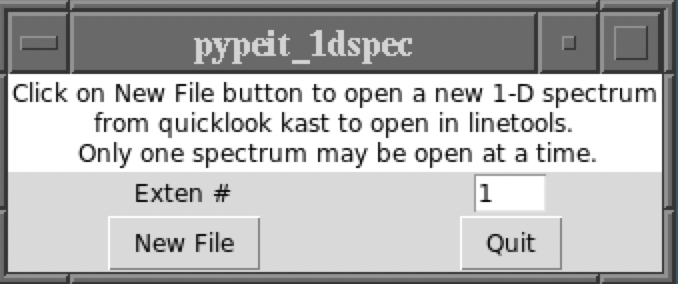
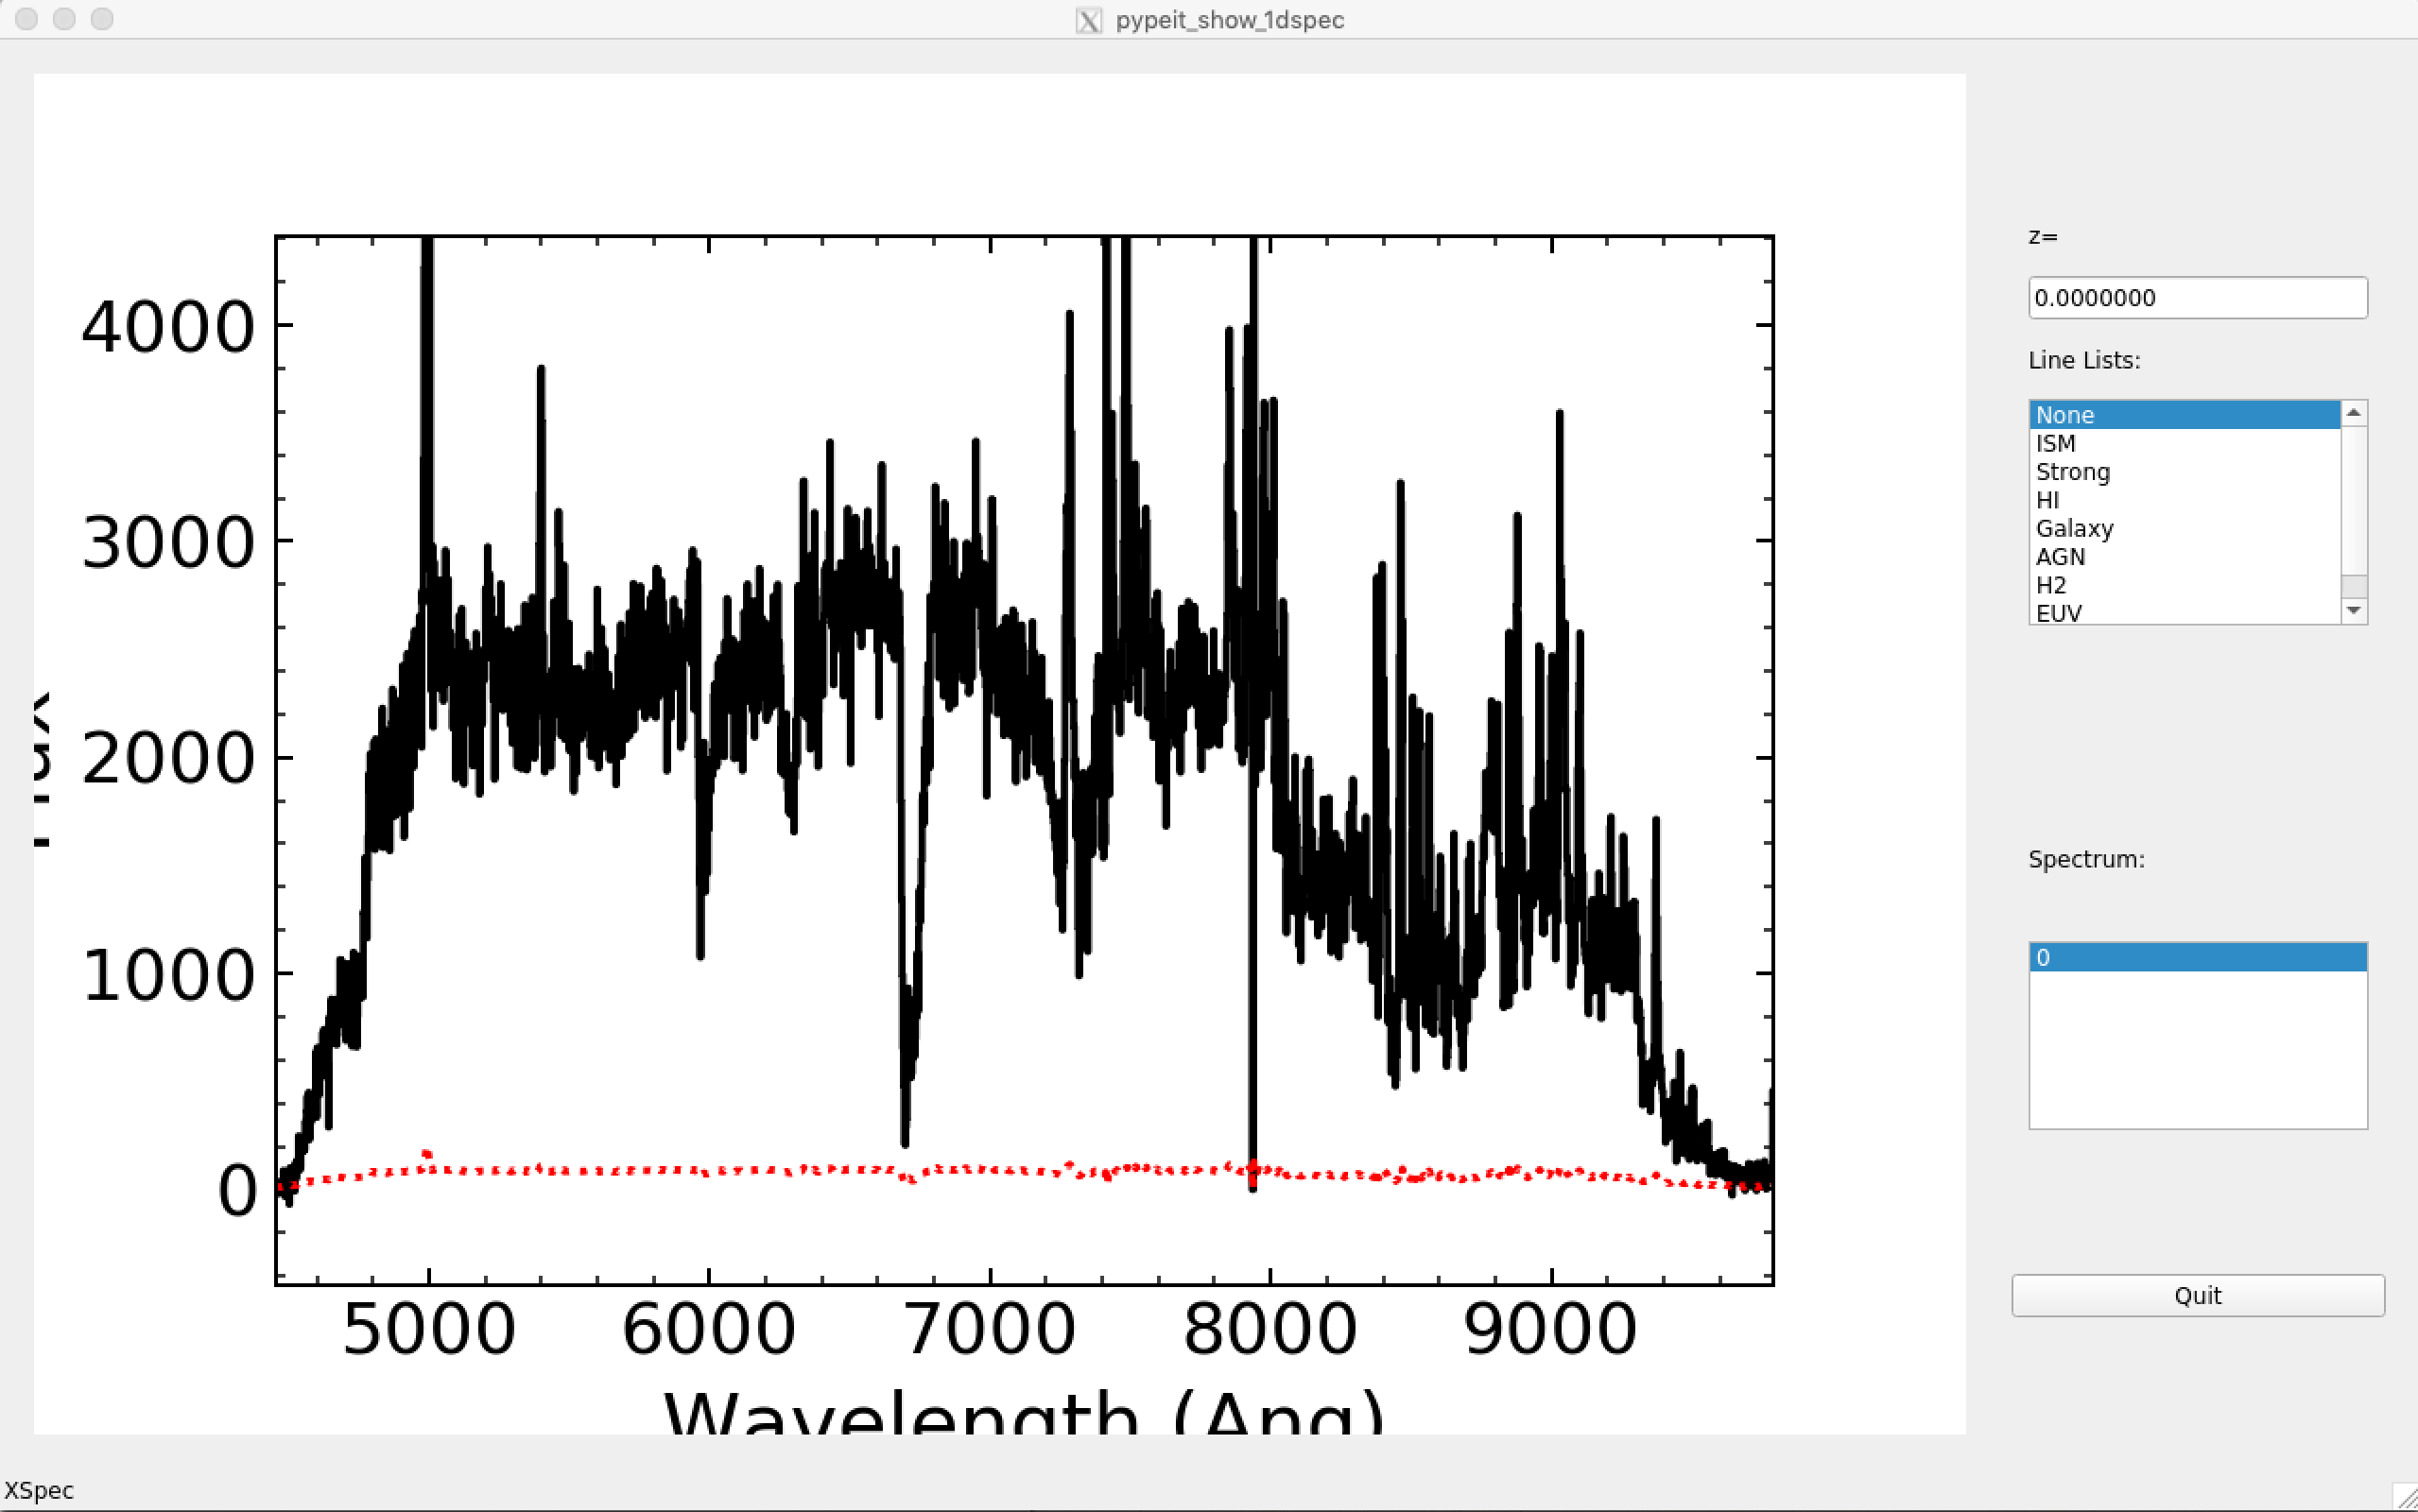
To use the GUI simply click on New File and use the file browser to navigate to the desired directory and select the file. If more than one 1-D spectrum was extracted from the image, you can select which extension will be displayed by setting the Exten # (default is 1 if only one spectrum extracted). Click Open in the file browser and a GUI will appear showing the spectrum and allow you to interact with it (see figure below).
More details on how to use the 1-d spectrum display is available on-line in the XSpecGUI documentation.
Examining the 2-d spectra generated by the quick-look script can be
useful if you want to examine the sky background subtraction, etc.,
though in most cases it is not necessary to look at the 2-d files.
The easiest way to examine these files is to use the pypeit conda environment as follows:
More information on the use of ginga and the 2-d spectrum tools are available at Spec2D Output.
Examining the 2-d Spectra
The above will create a ginga display window. In another xterm window
do the following to display the 2-d spectrum files:
e.g. pypeit_show_2dspec ~/shane_kast_blue_A/spec2d_b126-CampbellsHydrogenStar_KASTb_2017Oct15T072636.790.fits
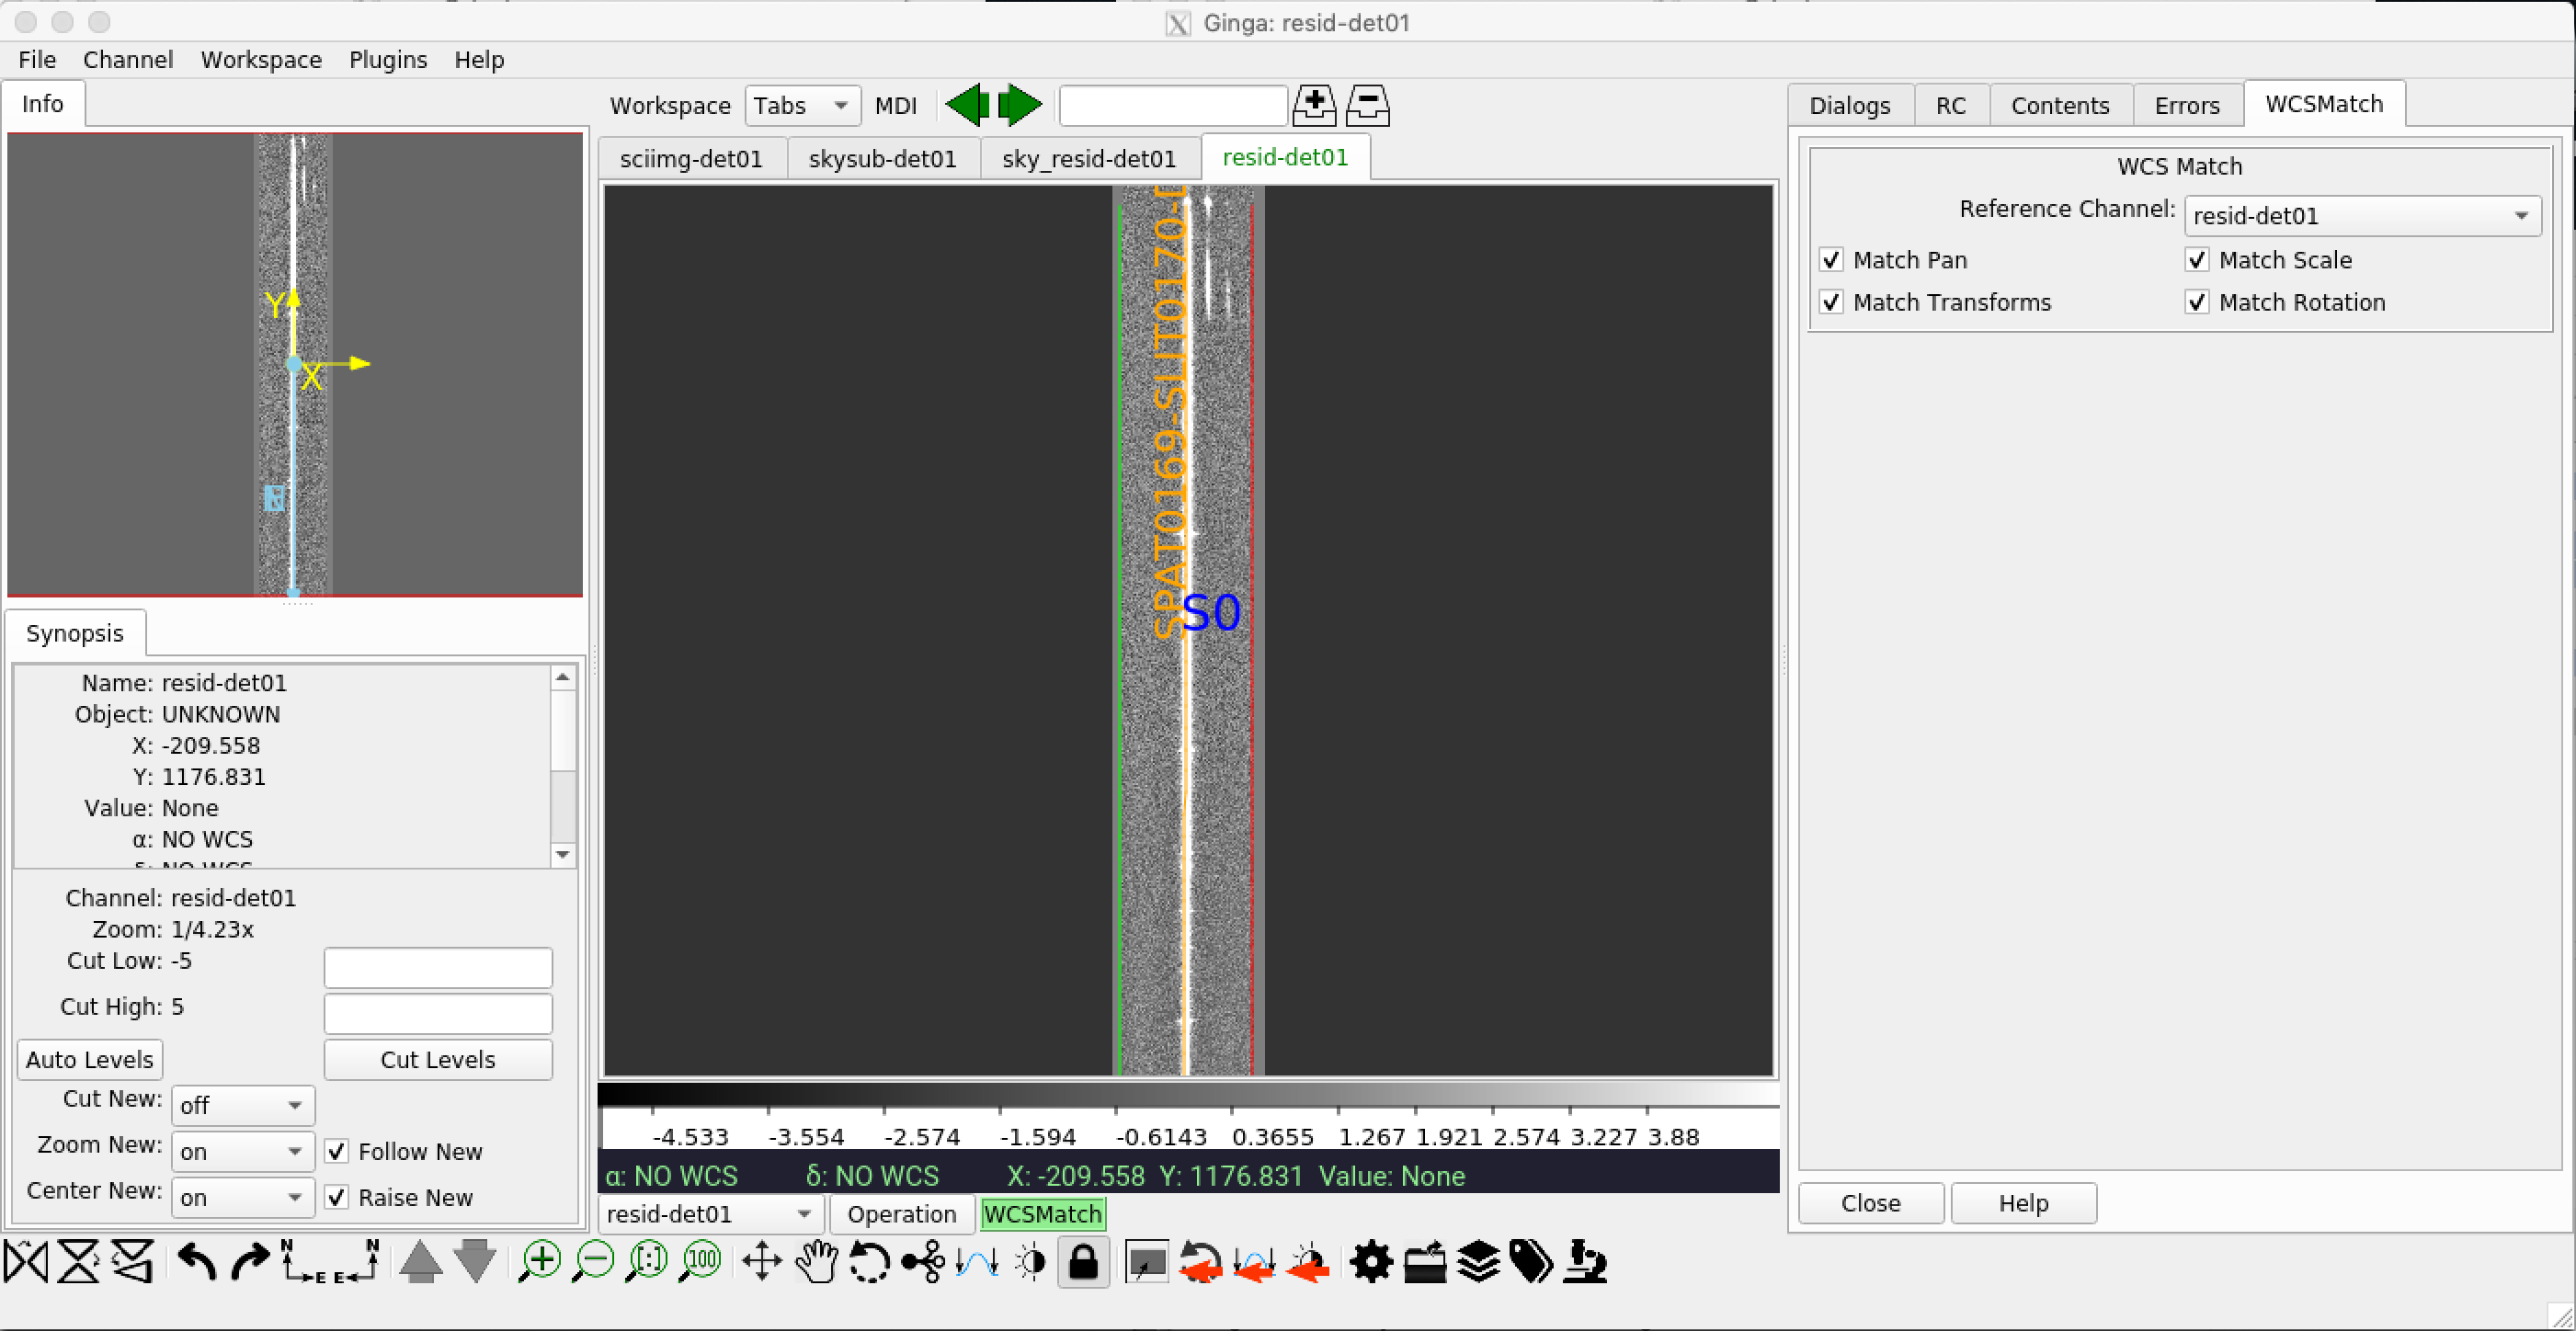
Ginga Image Display GUI for pypeit 2-d spectrum file.
Support Astronomers (sa@ucolick.org) Last modified: Thu Apr 27 00:24:05 PDT 2023