Showmidpoint
Showmidpoint is software used with the photon integrator to graphically display the number of counts detected by the integrator during the course of the exposure and display the photon weighted midpoint time of the exposure.
There are two versions of the software, the original Showmidpt and the newer version, Showmidpt2, which has some additional features..
The software is started from catpc or middie computers with the
command showmidpt. This brings up the GUI shown
in Figure 1.
The top section of the GUI displays a graph of the number of counts
detected by the integrator as a function of time, as well as the total
number of counts.
The lower section of the GUI displays the observation number along
with the exposure start, photon weighted midpoint, and exposure end
times. The total number of counts and missed samples are also
displayed for each exposure. These figures will be displayed at the
time the shutter closes and are recorded in the FITS header of the
data.
The software is started from catpc or middie computers with the
command showmidpt2. This brings up the GUI shown
in Figure 2.
The top section of the GUI displays a graph of the number of counts
detected by the integrator as a function of time, as well as the total
number of counts.
The middle section of the GUI displays the observation number along
with the exposure start, photon weighted midpoint, and exposure end
times. The total number of counts and missed samples are also
displayed for each exposure. These figures will be displayed at the
time the shutter closes and are recorded in the FITS header of the
data.
If the yellow message bar says something other than that it is connected
to the notifier, contact a support
astronomer for assistance. If all is well, you may click the
OK button to dismiss the message.
The bottom section allows you enter a count number at which the
spectrum will have the required signal and the exposure will stop and
readout. When you enable the stop and readout function by clicking the
Enable button, the bottom section will become green indicating it is in use, until Disable is clicked (see Figure 3).
Showmidpt
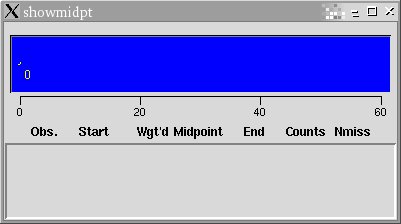
Figure 1: Showmidpoint GUI
Showmidpt2
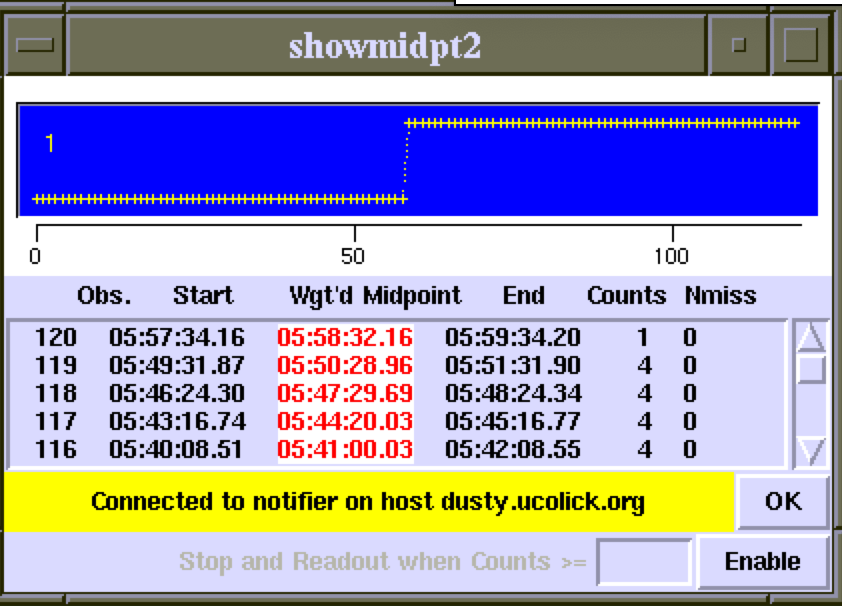
Figure 2: Showmidpoint2 GUI
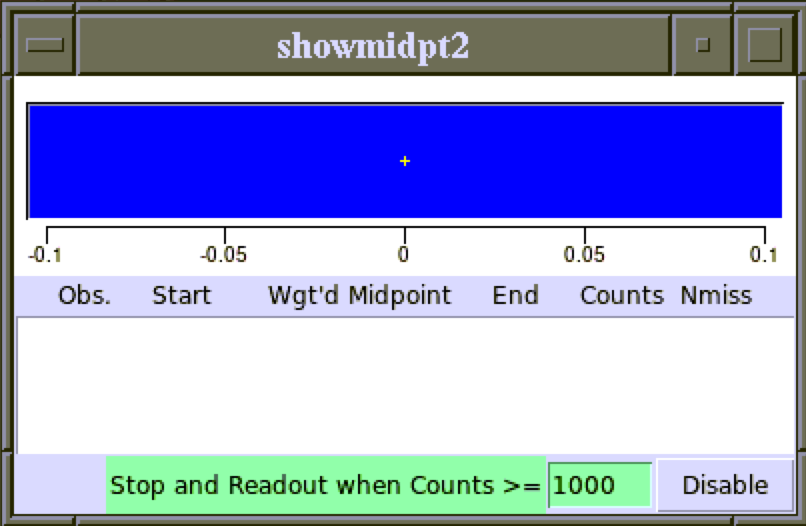
Figure 3: Showmidpoint2 GUI
Support Astronomers
(sa@ucolick.org)
Last modified: Thu Aug 6 13:53:54 PDT 2020